Documentation
Save CSV data from WebFront to Excel
Graphs in the WebFront are displayed using CSV data sets. In order to make these available in a neat and legible form for further use in Excel, there is the "Text-To-Columns" functionality.
This works for any CSV data set. The CSV data broken up in this way can, for example, be used for Excel graphics or the like of.
Example
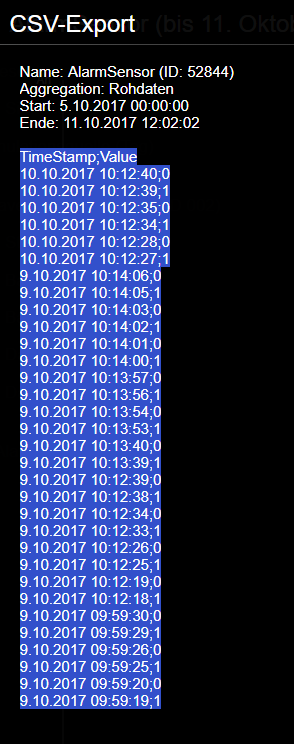
Step 1 - CSV Export Copy Record
Within the WebFront the graph symbol and then the menu item "CSV" have to be clicked on. In the popup (see picture) the data records simply have to be marked and copied with "Ctrl + C".
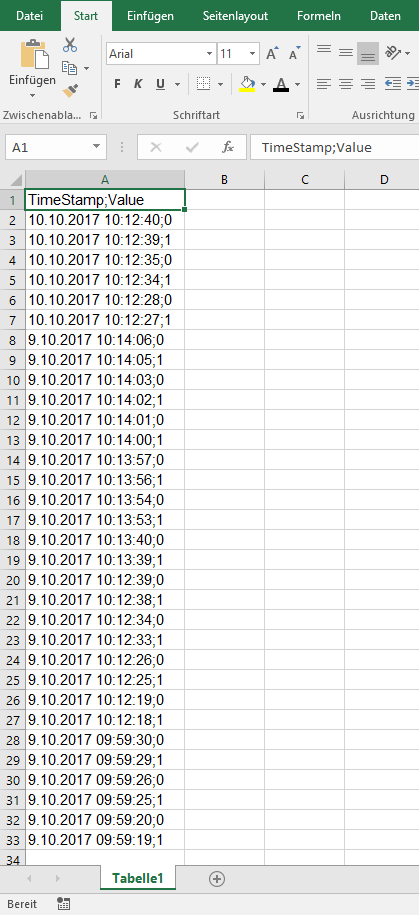
Step 2 - Paste
The data needs to be pasted into an empty table with "Ctrl + V". If necessary, the font color must be changed to black, as the white font color may have been adopted.
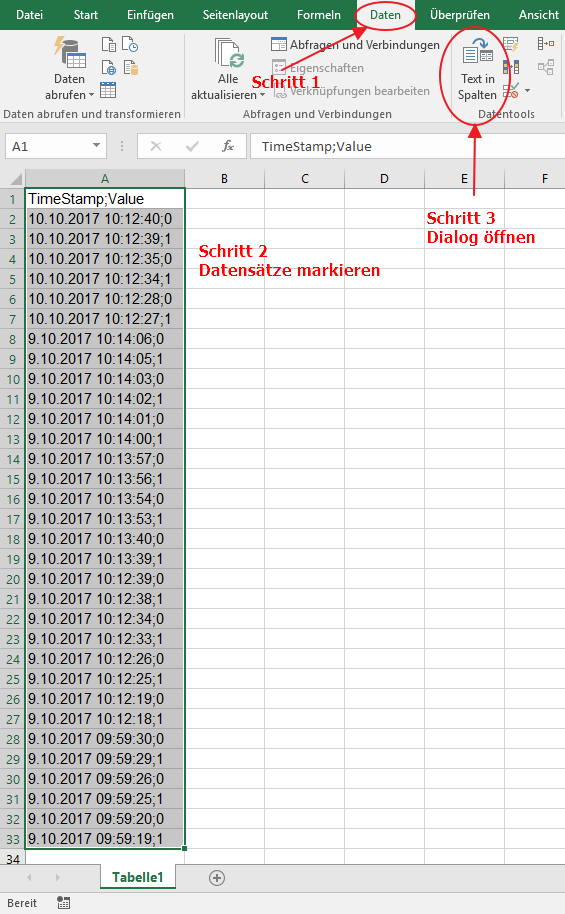
Step 3 - Text to Columns
The "Text to Columns" function is used to split the data records.
To do this, the "Data" tab must be selected and all data records highlighted.
Then the "Text to columns" button must be clicked on and a dialog opens.
Step 4 - Dialog
The dialog proceeds in 3 steps.
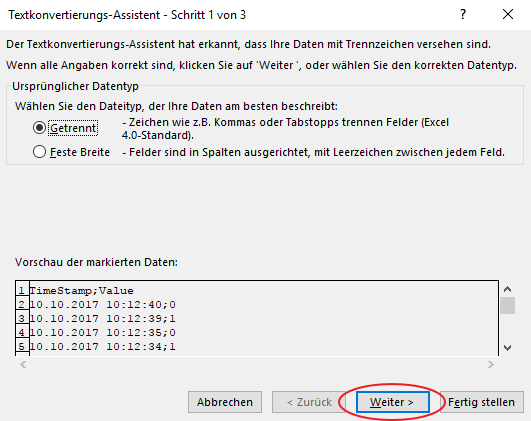
Click "Next".
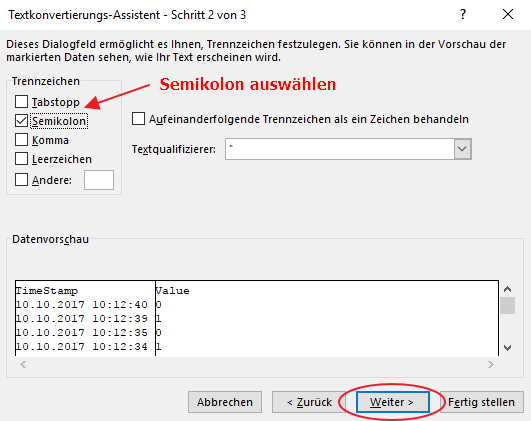
Select a semicolon as it separates the records. Click "Next".
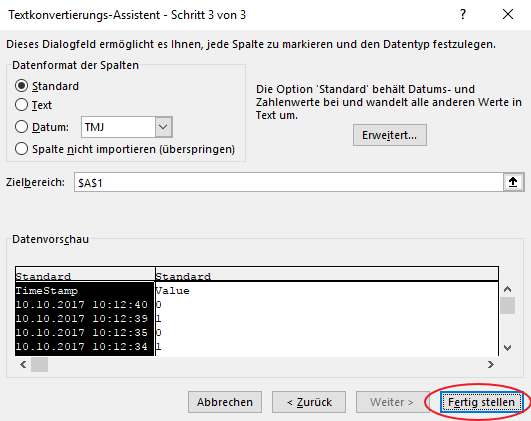
Click "Finish".
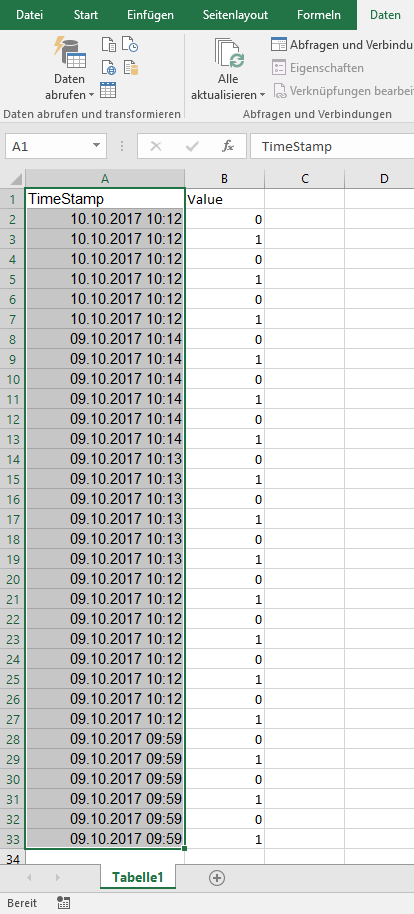
Result
The table should then look like this.