Documentation
PDFReport (Consumption)
Require: Symcon >= 6.0
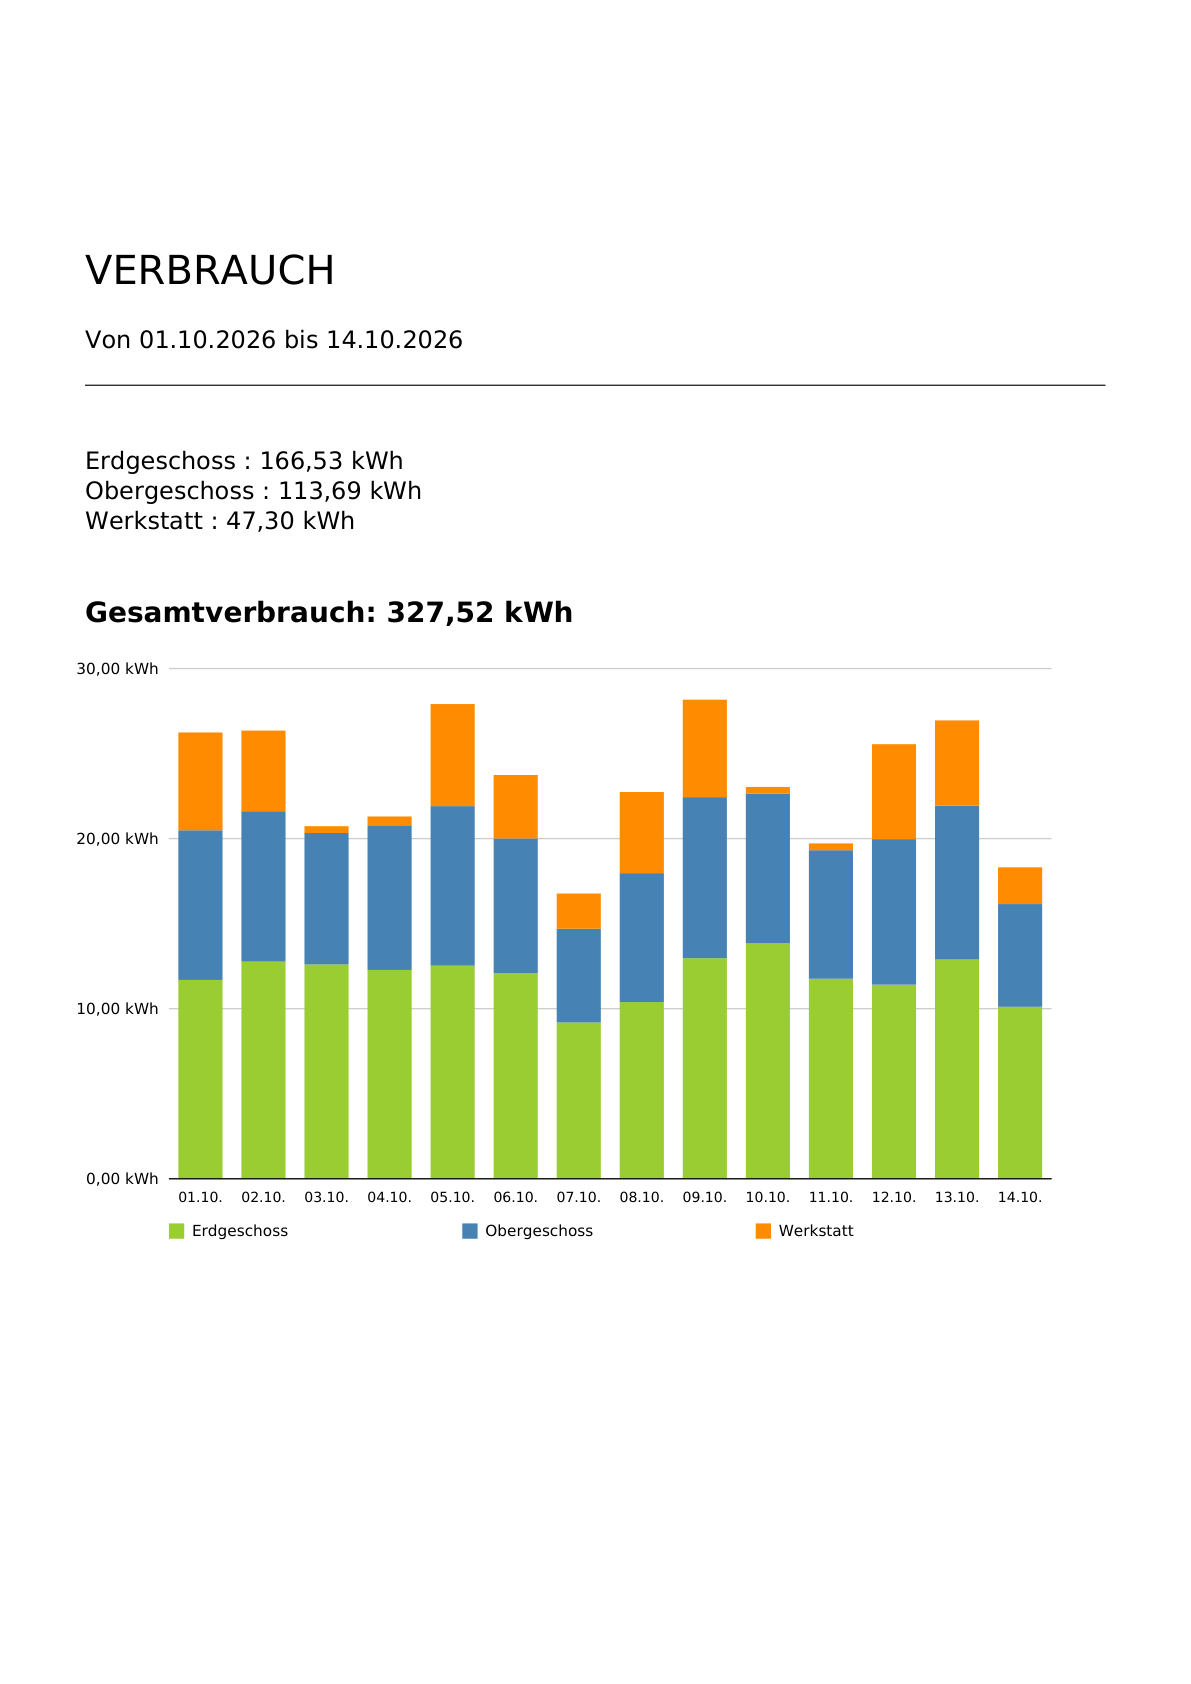
This module creates a consumption report as a PDF. The report contains the individual consumption of the selected counters, the total consumption and a bar chart for the selected time range.
Scope of functions
- Creating and downloading the report as a PDF
- Individual and total consumption of any number of counters in a freely selectable time range
- Stacked bar chart whose intervals depend on the length of the time range
- Formatting of all values based on the first counter variable, so the report is not tied to a specific unit
- Logo in the header of the report
- Sending the report by e-mail using RAC_SendReport
The intervals of the bar chart depend on the length of the time range:
| Time range | One bar represents |
|---|---|
| 1 day | 1 hour |
| Up to 62 days | 1 day |
| Up to 731 days | 1 month |
| Longer | 1 year |
Software installation
The module can be found via the Module Store under the category "Information"=>"Preparation" or directly by searching for "Report Module". The "Install" button makes the module available to Symcon.
Setting up the instances in Symcon
- Under "Add Instance", the 'Report (PDF, Consumption)' module can be found using the quick filter.
- More information about adding instances can be found in the Instances documentation
Configuration Page:
| Name | Description |
|---|---|
| Logo | Graphic as PNG or SVG that is displayed in the header of the report |
| E-Mail SMTP | SMTP instance used to send the report |
| Different receiver | String variable with the e-mail address the report is sent to. If it does not contain a valid address or no variable is selected, the receiver entered in the SMTP instance is used |
| Counters | List of the counters shown in the report |
The "Counters" list has the following columns:
| Name | Description |
|---|---|
| Name | Name of the counter in the report. If the field is empty, the name of the variable is used |
| Counter | Integer or float variable that is logged as a counter |

All values in the report are formatted based on the first variable in the list, including those of the other counters. There is no conversion, so the counters of a report should use the same unit.
Example document
Status variables
The status variables/categories are created automatically. Deleting individual ones can lead to malfunctions.
Status variables
| Name | Type | Description |
|---|---|---|
| Start | Integer | First day of the time range. The report starts at 00:00 on this day |
| End | Integer | Last day of the time range. This day is fully included in the report |
| Generate | Script | Executable to update the PDF |
| Report (PDF) | Media | Created PDF, which can be downloaded via the visualization or sent by e-mail. |
| Chart | Media | Chart for viewing the counters in the visualization. It is not part of the PDF |
Visualization
The start and end date can be entered via the visualization, the PDF can be generated and downloaded, and the counters can be viewed in the chart.