Documentation
Graph
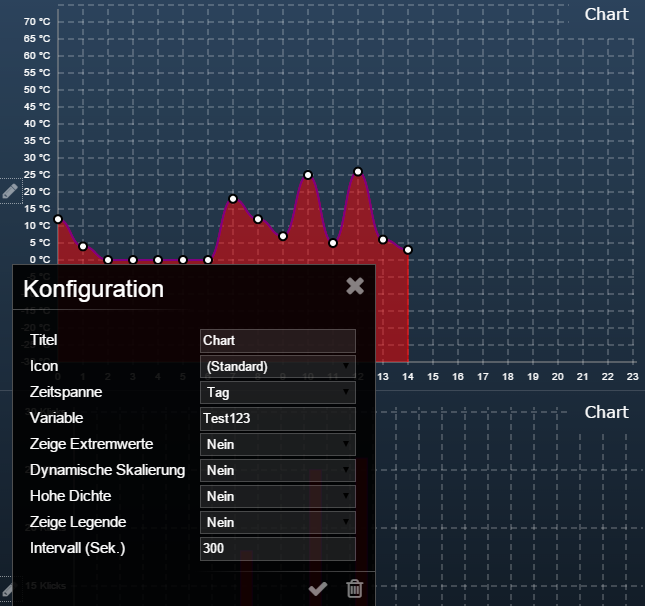
A full-screen graph will be shown directly in the WebFront.
A single logged variable or a chart object can be presented.
Properties
- Title: Title for the item in the TabPane navigation. If no individual name is specified, the object name of the selected variables will be displayed.
- Icon: Icon that appears next to the title in the TabPane navigation. By default, no icon will be displayed.
- Period of Time: The display area of the graph can be set to hour, day, week, month, or year.
- Variable: Here a logged variable or chart media file to be displayed can be selected.
- Show extreme values: This option specifies whether the graph is displayed with or without extreme value curves, if available.
- Dynamic Scaling: If the dynamic scaling is enabled, the graph will be dynamically scaled according to the minimum and maximum values in the time range. Otherwise, scaling will be performed according to the minimum and maximum specified in the variable profile of the selected variable.
- High Density: Increases the data point density, which makes the graph more accurate. Works only with line charts or logged variables on "Standard" -Logging.
- Show legend: Turn the legend on / off.
- Intervall (sec): The displayed graph will be automatically updated in seconds according to the interval set here. By default, this happens every 300 seconds.