Documentation
Energy Dashboard
Require: IP-Symcon >= 8.1
The energy dashboard serves as an overview of several meters with several diagrams.

At the moment the energy dashboard is still under development and therefore only available at enquiry by mail.

The enterprise features are explained below. The features for all users are still under development.
Purchase of the energy dashboard
The Enterprise version of the Energy Dashboard can be purchased as an add-on for Symcon by mail.
setting up the energy dashboard
To use the energy dashboard, it must first be set up. To do this, the instance of a ‘tile visualisation’ is called up in the console. Here you should ensure that the checkbox with the label ‘Show energy dashboard’ is activated in the ‘Appbar’ section. This will display the lightning bolt and thus the access in the visualisation.
The types and areas can now be defined in the ‘Energy dashboard’ section.
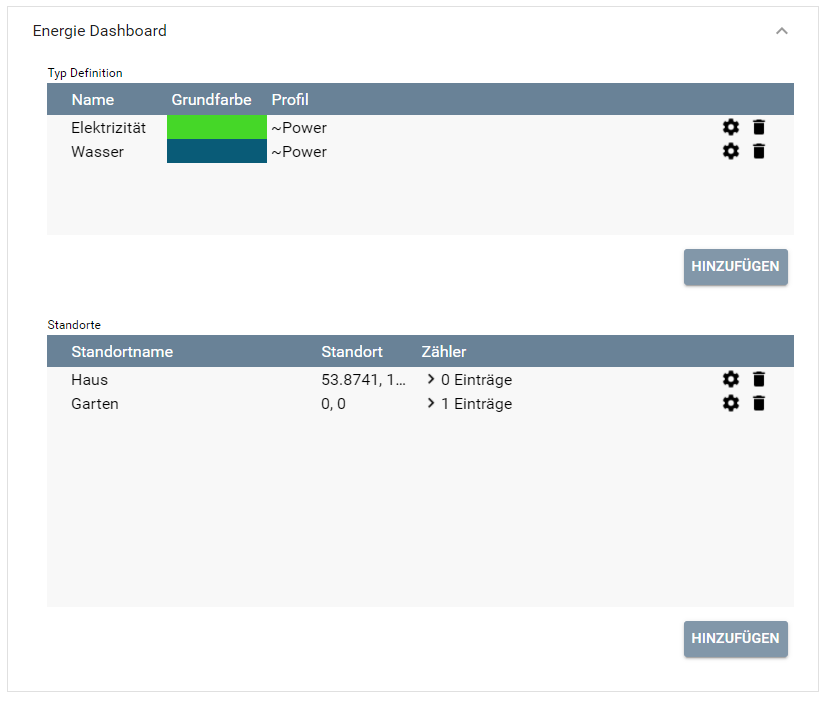
Definition of types
Initially, the types electricity, water and gas are defined.
| name | type | description |
|---|---|---|
| Name | Free text | The name of the type, which can be freely specified by the user. |
| Basic colour | Colour selection | Selection of a basic colour for the diagrams. All areas of the same type are displayed in a variation of the colour in the diagrams. |
| Profile | Profile selection | Selection of a profile. This allows the values of the diagrams to be formatted with a suffix/prefix. |
configuration of areas
The areas are set up as a tree. Click on Add to create an area at the top level.
Click on an area and then click on Add to create an area below the selected area.
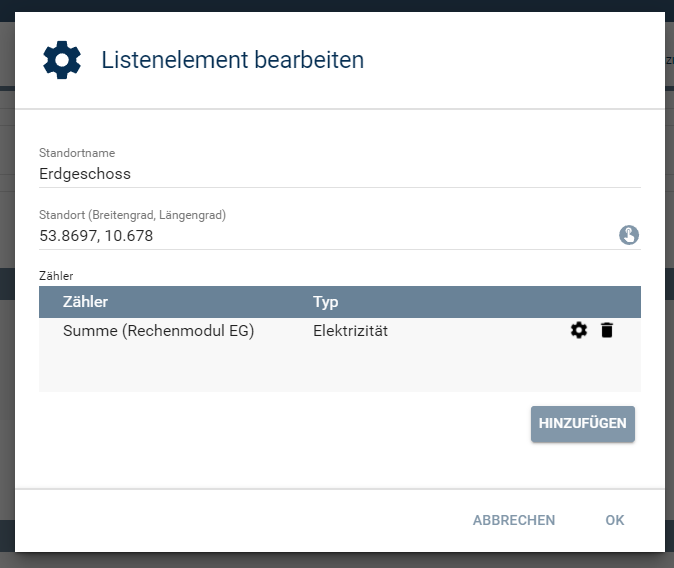
Each area has the following configurations:
| Name | Type | Description |
|---|---|---|
| Area name | Free text | Freely assignable name for the area. This will be displayed later in the energy dashboard. |
| Location | Coordinates selection | Optional selection of the coordinates of the area. |
| Meters | List | Configuration of the relevant meters |
configuration of the counters
The counters can be added optionally.
| name | type | description |
|---|---|---|
| Counter | Variable selection | Selection of the counter variable that provides the aggregated values for this area. |
| Type | Type selection | The type of counter based on the previously defined types |
utilisation of the energy dashboard
If the energy dashboard has been activated, a lightning bolt icon appears in the app bar of the visualisation. Click on it to open the energy dashboard.
The Energy Dashboard
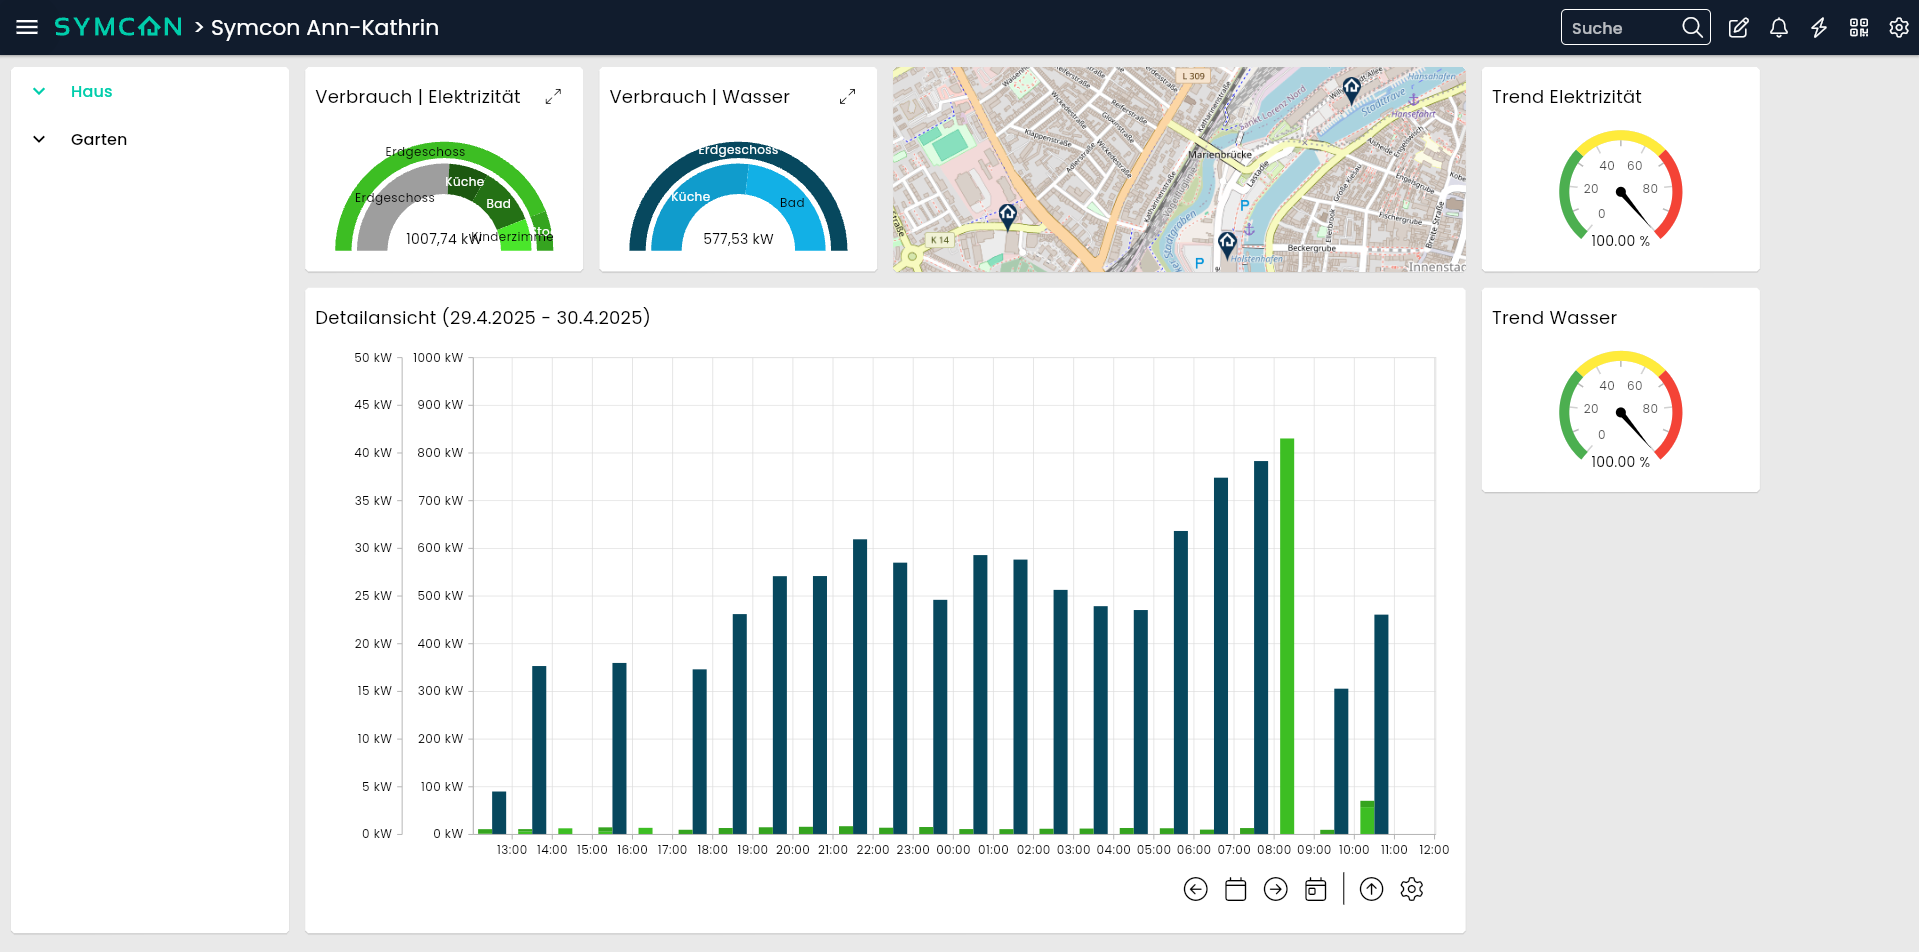
Tree
The tree reflects the configuration of the areas by name.
The first area is initially selected. If there is an arrow next to the area, the area can be expanded, allowing you to access subordinate areas.
Clicking on the various areas updates the values of the diagrams and the map.
Diagrams
When calling up the energy dashboard, the current day is selected as the time period and the time span hour.
Detail view
The selected time period is displayed in the detailed view.
Consumption diagram
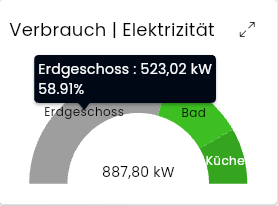
The consumption diagram shows the selected period with the time span of the day. The outer doughnut shows the selected counter, if necessary, and the counters directly below it. The inner doughnut is displayed if there is still a level below the selected area.
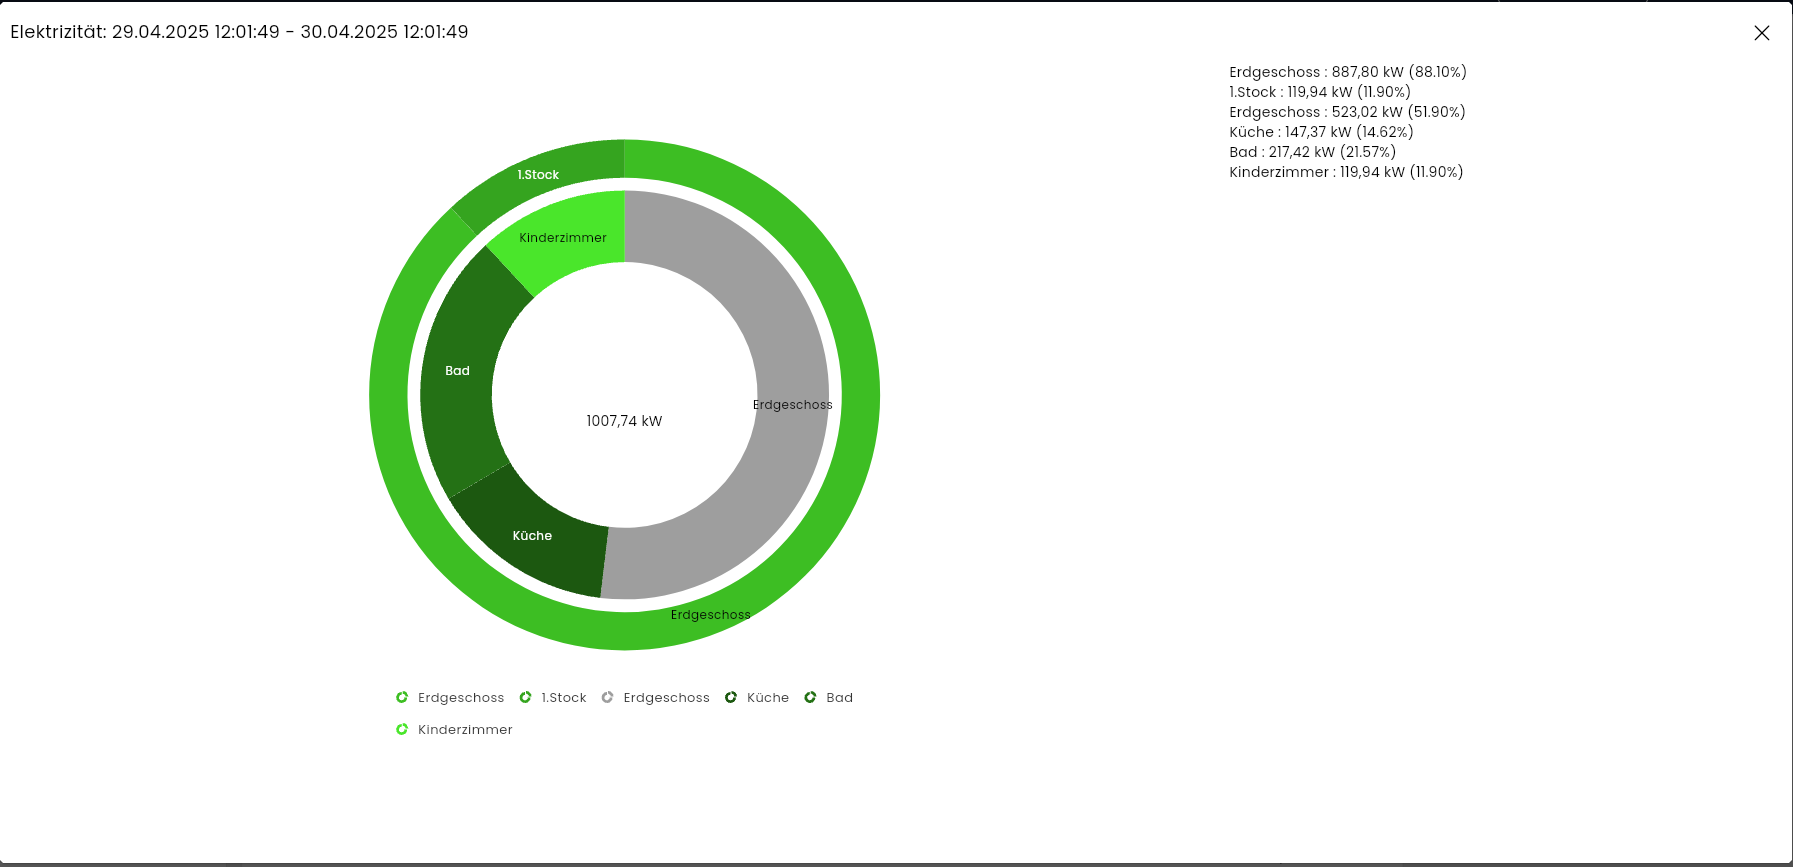
Click on the maximise button to enlarge the doughnut and display a detailed list of the entries.
Conditional display of counters
Counters are displayed conditionally in the detailed view and the doughnut chart.
- If the selected area has a counter and no areas below it, this is displayed.
- If the selected area has no counter and no areas below it, it is not displayed.
- If the selected area has areas below it, the area counters below it are displayed.
- If the area has a counter and its total does not match the subordinate area counters, the difference is displayed in grey in addition to the subordinate area counters.
Trend diagram
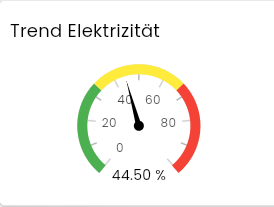
The trend diagram shows the percentage relationship between the top area and the selected area.
map
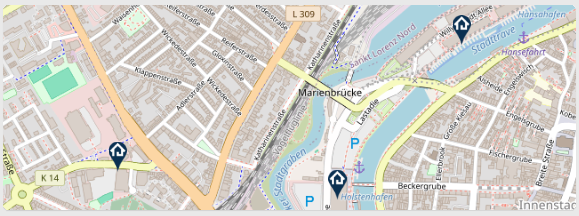
The map lists the configured coordinates. If no coordinates are configured for the selected area, the subordinate areas are searched for coordinates. This means that there can also be several markers on the map. If no area is found, a text is displayed instead of the map. OpenStreetMap is used for the map.
Translated with DeepL.com (free version)